B. Three specific examples of common structure
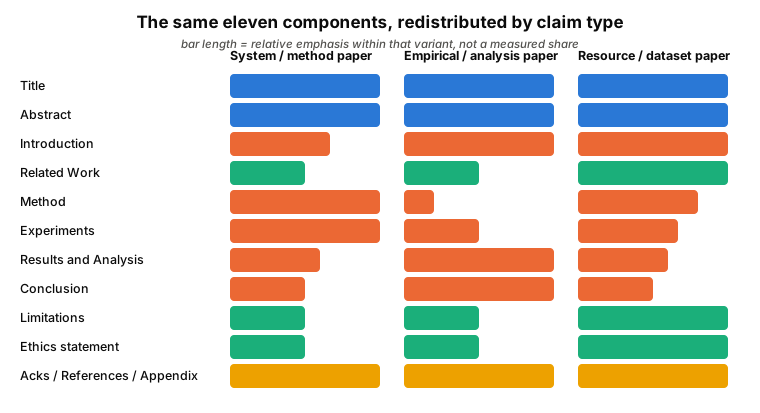
Section I.A described a single macro-structure, but the second justification given for this course’s rhetorical angle (Introduction.md) was precisely that no single structure fits every kind of contribution. This section makes that claim concrete by examining three structural variants, each a common redistribution of the same eleven components, driven by a different kind of central claim. The point of the comparison is not to catalogue every possible structure — the space of variation is larger than three cases — but to demonstrate, with enough detail to be checked against articles the reader already knows, how the type of claim being made systematically reshapes which components grow, shrink, merge, or disappear.
1. The system / method paper
The claim being made is that a new model, algorithm, or technique improves on prior approaches along some measurable axis. The Method section is the center of gravity of the article and is correspondingly the longest claim-bearing component; Experiments and Results exist chiefly to substantiate the Method’s claim through comparison against baselines. Related Work is typically compressed and placed early, since its main function here is to establish what counts as a baseline rather than to develop an extended intellectual history. Limitations tends to be narrow and technical (failure cases, computational cost, hyperparameter sensitivity) because the claim itself is narrow and technical.
Structure. The Introduction typically closes with an explicit, often enumerated, list of contributions (“Our contributions are threefold: …”), which functions as a table of contents for the claim-bearing components that follow. Related Work is compressed into a taxonomy of competing approaches, organized so that each becomes a named baseline later. The Method section is usually subdivided by component (architecture, objective function, training or inference procedure), mirroring the order in which a reader would need to reconstruct the system. Experiments and Results are kept separate from Method: Experiments fixes the protocol (datasets, baselines, metrics, implementation details), and Results reports outcomes against that fixed protocol, often followed by a shorter Analysis or Ablation subsection that isolates the contribution of individual components.
Objectives. The article must establish, in order: that the problem is real and unsolved by existing approaches; that the proposed method is a coherent and reproducible technical contribution, not an incremental combination of known parts; and that it measurably outperforms the strongest available baselines under a fair protocol. A secondary objective, carried mainly by the ablation study, is to show that the improvement is attributable to the specific design choices claimed as novel, rather than to incidental factors such as extra data or compute.
Tone. Confident and comparative: verbs like “outperforms,” “achieves,” and “improves upon” are common, and hedging is largely confined to the Limitations section rather than distributed through the Results. Prose density is highest in the Method section, where precision often takes priority over readability, and lowest in the Conclusion, which restates the contributions with little new content. Claims of generality (“our method generalizes to …”) are typically hedged more than claims of measured performance, since the latter are directly supported by the Results table and the former are not.
Common tables, figures, and other apparatus. An architecture or pipeline diagram near the start of the Method section; a main results table comparing the proposed method against baselines, with the best score per column typically bolded; an ablation table removing one component at a time; a hyperparameter or training-configuration table, often deferred to an appendix; occasionally, a qualitative table of input/output examples illustrating a failure mode of baselines that the method avoids.
A worked example. Vaswani et al., “Attention Is All You Need” (NeurIPS 2017), introducing the Transformer architecture, is a clean instance of this structure: a short Introduction motivating the replacement of recurrence with attention, a Method section organized component by component (scaled dot-product attention, multi-head attention, positional encoding), a main results table reporting BLEU scores against prior state-of-the-art systems on machine translation, and an ablation table (varying the number of attention heads and other architectural choices) isolating which design decisions drive the improvement. The article predates the Limitations and Ethics statement now expected at most venues (I.A), which is itself a useful illustration of how the prototype has changed since 2017 — a reader reconstructing this article today would be expected to add both.
2. The empirical / analysis paper
The claim being made is a finding about how existing models, data, or phenomena behave, rather than a proposal for a new artifact. Here the weight shifts away from Method — which may shrink to a brief description of an existing model or a probing procedure — and toward Results and Analysis, which routinely expands into the article’s longest section and is sometimes split into several thematically organized subsections rather than presented as a single block. The Introduction carries more argumentative weight than in the system paper, since it must motivate a question rather than a fix, and Related Work is often woven through the Analysis section itself rather than isolated in one place, because prior findings are the direct object of comparison rather than background.
Structure. The Introduction typically states an explicit research question or a prior assumption to be tested, rather than a contribution list, and previews the answer rather than a system. A short Setup or Method section fixes the models, data, and probing or analysis procedure used, but is not itself a claim-bearing component. The bulk of the article is organized as a sequence of sub-questions or themes (frequently labeled RQ1, RQ2, … or given descriptive subheadings), each combining a result with its interpretation in the same subsection, rather than deferring all interpretation to a separate Discussion. A Discussion or Implications section at the end steps back from the individual findings to state what they jointly establish about the field’s prior assumptions.
Objectives. The article must establish that the question is well-posed and consequential, that the method used to answer it is valid (controls for confounds, uses an appropriate baseline or null hypothesis), and that the resulting finding is robust rather than an artifact of one model, dataset, or metric. Because there is no artifact to hand the reader, the persuasive burden falls almost entirely on the soundness of the empirical method and the breadth of the evidence gathered.
Tone. More exploratory and more heavily hedged than the system paper: “suggests,” “is consistent with,” and “we observe” recur where the system paper would use “we show” or “achieves.” The prose stays closer to a narrative connecting each sub-finding back to the motivating question, since the argument’s coherence — not any single number — is what the reader is asked to evaluate. Overclaiming a causal or universal finding from correlational or narrow evidence is the most common tone failure specific to this structure, and is addressed further in Part III.
Common tables, figures, and other apparatus. Trend plots across a varied condition (model scale, layer depth, training steps, or similar); heatmaps for per-category or per-layer results; statistical-significance annotations on tables or plots; a table breaking results down by linguistic phenomenon, category, or subgroup rather than a single aggregate score; short qualitative tables of illustrative examples used to make an abstract finding concrete for the reader.
A worked example. McCoy, Pavlick, and Linzen, “Right for the Wrong Reasons: Diagnosing Syntactic Heuristics in Natural Language Inference” (ACL 2019), tests the prior assumption that neural NLI models perform genuine entailment reasoning. Rather than proposing a new model, it constructs a diagnostic evaluation set (HANS) targeting three syntactic heuristics that would produce correct answers on standard datasets without correct reasoning, then shows that state-of-the-art models’ accuracy collapses precisely on the cases engineered to be misled by those heuristics. The results are broken down by heuristic category rather than reported as one aggregate number, and the Discussion draws the general implication — that high accuracy on a standard test set is not strong evidence of the targeted linguistic capability — directly from that breakdown, illustrating the RQ-driven, interpretation-embedded structure described above.
3. The resource / dataset paper
The claim being made is that a newly constructed dataset, benchmark, or annotated resource is useful and reliable. The Method component is replaced by a description of data collection and annotation procedure, and a component absent from the prototype in I.A becomes claim-bearing in its own right: a data statistics and quality analysis section (inter-annotator agreement, coverage, known biases), which functions here the way Results functions in a system paper. Experiments, if present at all, are typically a demonstration that the resource supports a baseline task rather than a comparison the article’s contribution depends on. Limitations and Ethics statements carry unusually high weight relative to the rest of the article, since the risks of a resource — misuse, unrepresentative coverage, annotation artifacts — propagate to every future article that uses it.
Structure. The Introduction motivates the resource by identifying a gap in existing resources (a missing language, domain, phenomenon, or scale) rather than a gap in method. Related Work is frequently retitled “Related Datasets” or “Related Resources” and organized as a direct comparison to prior resources rather than prior methods. Data Collection and Annotation describes sourcing, annotation guidelines, annotator recruitment and compensation, and quality-control procedure, in roughly the chronological order in which the resource was built. A Data Statistics and Quality Analysis section then reports scale, coverage, and inter-annotator agreement. Baseline Experiments, where present, apply simple or established models to the resource, chiefly to demonstrate that it supports the intended task rather than to advance the state of the art.
Objectives. The article must establish that the resource fills a genuine, previously unfilled gap; that it was constructed with a sound and reproducible methodology; that its quality is adequate for its intended use (typically evidenced by inter-annotator agreement or comparable quality metrics); and that its release is responsible with respect to consent, licensing, privacy, and foreseeable misuse. Persuading the reader to trust the resource enough to build on it is the central objective, which is why quality analysis and Limitations carry unusually high argumentative weight here relative to the other two structures.
Tone. Procedural and descriptive in the Data Collection section, where the goal is reproducibility of process rather than persuasion; more cautious and stewardship-oriented in Limitations and the Ethics or Data Statement, with language such as “we release,” “we recommend,” and “users of this resource should” replacing the comparative language typical of the system paper. Claims about the resource’s scale or novelty (“the largest dataset of its kind”) are stated plainly, since they are directly verifiable, while claims about downstream utility are usually hedged, since utility can only be demonstrated indirectly through baseline results.
Common tables, figures, and other apparatus. A comparison table against existing datasets (size, language or domain coverage, license, annotation type); a data statistics table (instance counts, split sizes, label or category distribution); an inter-annotator agreement table, typically reporting a chance-corrected agreement statistic per category; an annotation pipeline diagram; a table of representative example instances paired with their annotations; a baseline results table, generally modest in scope and framed as a usability demonstration rather than a competitive comparison.
A worked example. Rajpurkar, Zhang, Lopyrev, and Liang, “SQuAD: 100,000+ Questions for Machine Comprehension of Text” (EMNLP 2016), introduces a reading-comprehension dataset built by having crowdworkers write questions and mark answer spans over Wikipedia passages. The Introduction motivates the resource against the smaller size and narrower answer format of prior comprehension datasets; a dedicated section describes the crowdsourcing pipeline and quality-control steps; a statistics section reports scale and answer-type distribution; and baseline experiments compare simple logistic-regression and human performance to establish the task’s difficulty rather than to advance a state of the art. Like the Transformer example above, it predates the Limitations and Ethics statement now expected of resource papers, where a current article would additionally be expected to discuss, for instance, the demographic composition of its crowdworkers and the licensing status of the source text.
Reading the variants against the prototype
In each of the three cases, the prototype from section I.A remains recognizable — the same eleven components appear, in largely the same order — but a different subset of them is claim-bearing, and it is exactly the components that would carry the article’s central claim under section I.A’s default reading that expand, while the rest contract or merge. Identifying which of these three shapes (or some other) a piece of writing belongs to is therefore a useful first step when planning an article: it determines, before any prose is written, which sections need to carry the argumentative weight and which can be written more briefly. Section I.C returns to this same claim-bearing/claim-bounding distinction and examines the function of each component independently of which structural variant it appears in.